Income Distribution: Interpreting Graphics
Activity |
Students will be working in pairs to explore more data about income and wealth distribution in the United States.
Each pair’s job will be to reflect on what they have learned by making a claim about contemporary American society and supporting that claim using evidence from the infographics.
Pairs will then present their claims and evidence to their classmates and discuss what wealth and income distribution in the United States says about contemporary American society.
Each pair of students will interpret one of the following graphics:
1. The Top 1%: What Jobs Do They Have?
2. What Percent Are You?
3. Where the 1% Fit in The Hierarchy of Income
4. Lower taxes For The Highest Earners
5. Do College Grads Earn Less Now Than 40 Years Ago?
6. Inequality is Most Extreme in Wealth Not Income
7. How Class Works
Your presentation will include the following:
The graphic itself.
A description of the graphic. Tell us what it is about.
What is surprising about the information presented?
How you might explain why the data is what it is?
What does the graphic say about the state of income distribution in America?
Finish this sentence with at least three pieces of information from your graphic,
"Today America is . . ."
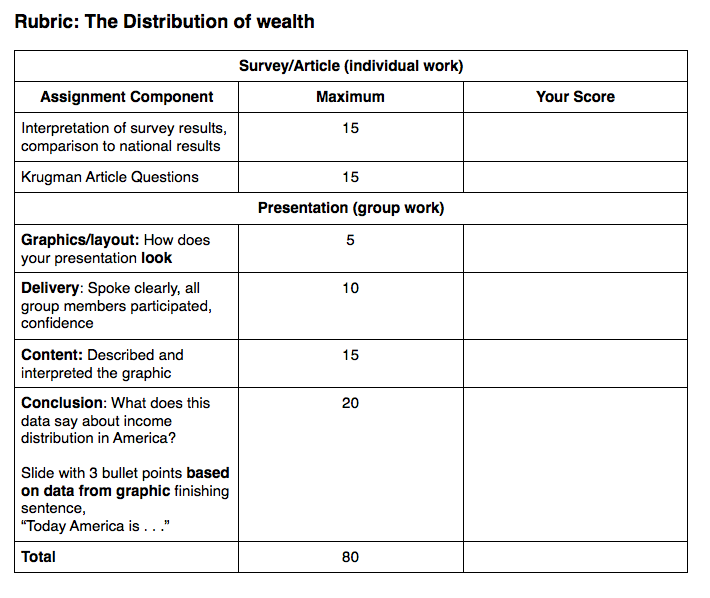
Rubric